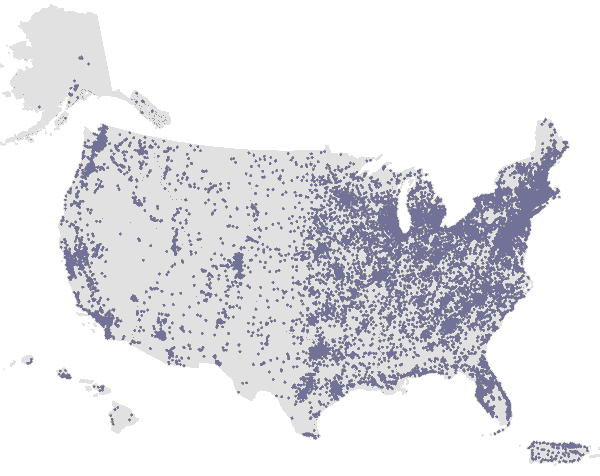
Geographic Characteristics
Participants at Enrollment 
Enrollment by State
| State | Women Enrolled | Percentage |
|---|---|---|
| Alabama | 401 | 0.8% |
| Alaska | 123 | 0.2% |
| Arizona | 1,553 | 3.1% |
| Arkansas | 343 | 0.7% |
| California | 4,222 | 8.3% |
| Colorado | 1,212 | 2.4% |
| Connecticut | 552 | 1.1% |
| Delaware | 162 | 0.3% |
| District of Columbia | 137 | 0.3% |
| Florida | 3,602 | 7.1% |
| Georgia | 1,367 | 2.7% |
| Hawaii | 109 | 0.2% |
| Idaho | 233 | 0.5% |
| Illinois | 2,613 | 5.1% |
| Indiana | 1,020 | 2.0% |
| Iowa | 641 | 1.3% |
| Kansas | 454 | 0.9% |
| Kentucky | 609 | 1.2% |
| Louisiana | 523 | 1.0% |
| Maine | 344 | 0.7% |
| Maryland | 1,470 | 2.9% |
| Massachusetts | 1,126 | 2.2% |
| Michigan | 2,280 | 4.5% |
| Minnesota | 1,031 | 2.0% |
| Mississippi | 306 | 0.6% |
| Missouri | 1,531 | 3.0% |
| Montana | 248 | 0.5% |
| Nebraska | 485 | 1.0% |
| Nevada | 243 | 0.5% |
| New Hampshire | 308 | 0.6% |
| New Jersey | 1,260 | 2.5% |
| New Mexico | 278 | 0.5% |
| New York | 2,579 | 5.1% |
| North Carolina | 1,663 | 3.3% |
| North Dakota | 120 | 0.2% |
| Ohio | 2,072 | 4.1% |
| Oklahoma | 423 | 0.8% |
| Oregon | 890 | 1.7% |
| Pennsylvania | 1,953 | 3.8% |
| Puerto Rico | 885 | 1.7% |
| Rhode Island | 252 | 0.5% |
| South Carolina | 625 | 1.2% |
| South Dakota | 172 | 0.3% |
| Tennessee | 863 | 1.7% |
| Texas | 2,499 | 4.9% |
| Utah | 304 | 0.6% |
| Vermont | 141 | 0.3% |
| Virginia | 1,520 | 3.0% |
| Washington | 1,532 | 3.0% |
| West Virginia | 261 | 0.5% |
| Wisconsin | 1,252 | 2.5% |
| Wyoming | 92 | 0.2% |
| Total | 50,884 | 100% |
Enrollment by Region
| U.S. Census Region | Number of Participants | Percentage |
|---|---|---|
| Northeast | 8,532 | 17% |
| Midwest | 13,689 | 27% |
| South | 16,743 | 33% |
| West | 11,010 | 22% |
| Puerto Rico | 883 | 2% |
| Missing | 27 | -- |
Passive Cohort
The percentages for each characteristic may not add up to 100 due to rounding. Those missing data or for whom a category was not applicable were excluded from the total (N = 3,066) for calculating percentages. Data approximates final passive follow-up data.
Enrollment by Region
| U.S. Census Region | Number of Participants | Percentage |
|---|---|---|
| Northeast | 500 | 17% |
| Midwest | 649 | 22% |
| South | 1,215 | 40% |
| West | 607 | 20% |
| Puerto Rico | 51 | 2% |
| Missing | 44 | -- |